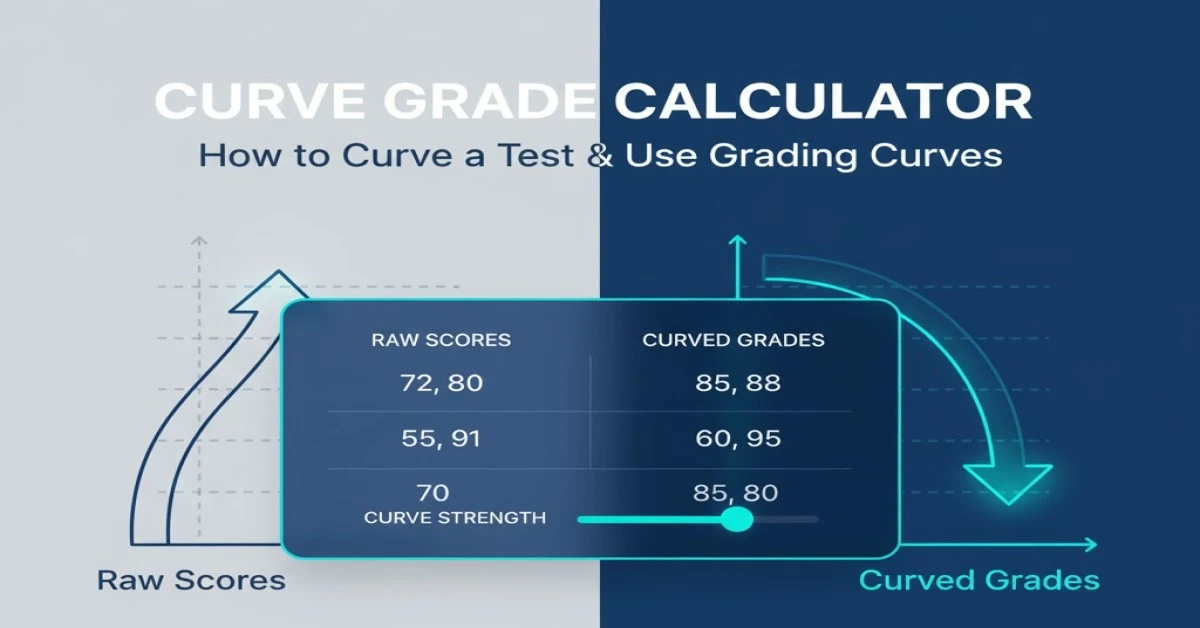
A curve grade calculator helps instructors adjust raw scores so grades better reflect performance goals. Whether you want to use a class curve calculator, grading curve calculator, or grading on a bell curve calculator, this tool makes it simple to curve a test. You can raise low scores, set top scores to maximum, or standardize your class using a bell curve.
Grading On A Bell Curve Calculator
Persistence: Checking…
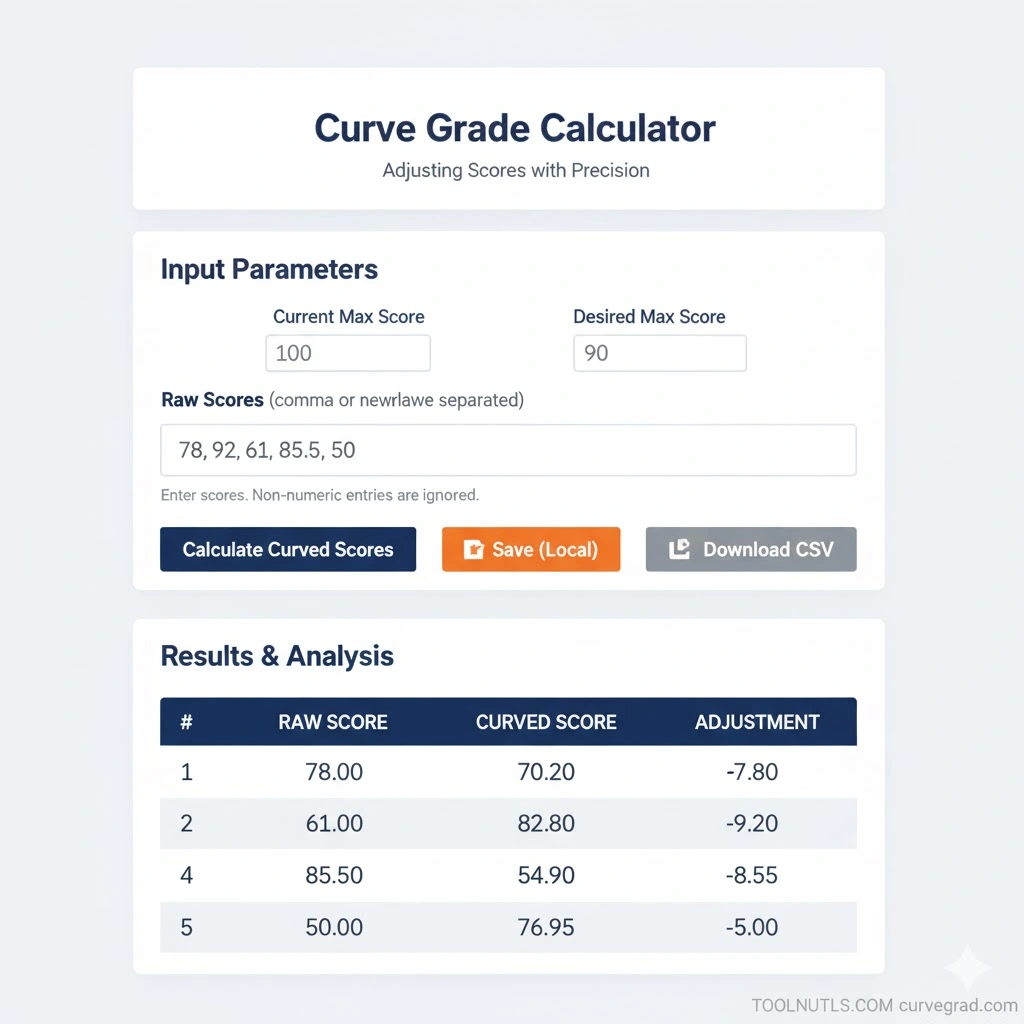
Tip: paste a column of scores or a comma-separated list. Non-numeric entries ignored.
Analysis & Curved Results
| # | Raw Score | Curved Score | Note |
|---|
In this guide, we’ll explain each method in plain language, provide step-by-step examples, and share tips for using a grading curve calculator effectively.
Quick overview — what this tool does
A class curve calculator allows you to:
- Paste raw student scores (comma, space, or newline separated).
- Choose a curving method.
- Set parameters (target mean, points to add, target standard deviation, etc.).
- See the curved scores, statistics (mean, standard deviation, min/max), and download a CSV.
- Optionally save/load settings (Firestore if configured, otherwise localStorage).
You can use it as a grading on a bell curve calculator or a curve a test calculator, depending on the method you choose.
1) Target Max (scale highest to max) — what it is and example
What it does
The Target Max method shifts all scores upward by the difference between the maximum possible score and the highest observed raw score. The goal: make the top-performing student(s) reach the maximum possible score, and raise everyone else by the same additive amount.
Formula
Shift = MaxPossibleScore − HighestRawScore
CurvedScore = RawScore + Shift
Let:
max= maximum possible score (e.g., 100)rawMax= highest raw score observed (e.g., 92)shift = max - rawMaxcurvedScore = rawScore + shift(capped atmax)
Step-by-step example
Suppose raw scores: 65, 72, 88, 91, 55.5, and max = 100.
- Find
rawMax. The scores are 65, 72, 88, 91, 55.5. The highest is91. - Compute
shift = max - rawMax = 100 - 91 = 9. - Apply shift to each score:
- 65 → 65 + 9 = 74
- 72 → 72 + 9 = 81
- 88 → 88 + 9 = 97
- 91 → 91 + 9 = 100 (cap at 100 if equal or exceed)
- 55.5 → 55.5 + 9 = 64.5
How it works:
The highest score in the class is shifted up to the maximum possible score. All other scores are increased by the same amount, ensuring the top performer reaches 100% while maintaining relative differences between students.
Example Table:
| Student | Raw Score | Curved Score | Note |
|---|---|---|---|
| Alice | 65 | 74 | Shift +9 |
| Bob | 72 | 81 | Shift +9 |
| Carol | 88 | 97 | Shift +9 |
| David | 91 | 100 | Capped at Max |
| Eve | 55.5 | 64.5 | Shift +9 |
Pros
- Simple and predictable.
- Keeps relative differences between students unchanged.
- Guarantees a top score equals full marks.
Cons
- If the top raw score is already at or above max, no change occurs.
- Can disproportionately improve low performers only by a fixed amount — may still leave many failing.
- If the shift is large, some scores might exceed realistic expectations even though capped.
Best Use: When you want the top performer to reach full marks without changing relative distances.
2) Additive Points — what it is and example
How it works:
A fixed number of points is added to all scores. This method is flexible and allows instructors to boost grades evenly, regardless of the highest score.
Formula:
CurvedScore = min(rawScore + pointsToAdd, max)
Example Table (Same raw scores: 65, 72, 88, 91, 55.5. Choose Points to Add = 10, max = 100.):
| Student | Raw Score | Curved Score | Note |
|---|---|---|---|
| Alice | 65 | 75 | +10 points |
| Bob | 72 | 82 | +10 points |
| Carol | 88 | 98 | +10 points |
| David | 91 | 100 | Capped at Max |
| Eve | 55.5 | 65.5 | +10 points |
Pros
- Easy to explain and justify to students.
- Works well when the entire exam was slightly harder than planned.
- Keeps differences between students equal.
Cons
- Doesn’t change spread or relative ranking.
- If pointsToAdd is too large, many students may hit the cap.
- Instructors must choose the pointsToAdd value wisely — a single number may not be fair across the distribution.
Best Use: Use a grading curve calculator when the exam was uniformly harder than expected.
3) Square-Root Curve (non-linear) — what it does and example
What it does
A square-root curve is non-linear: it increases lower scores proportionally more than higher ones. Often used when instructors want to help lower-performing students more, without inflating top scores too much.
Formula (one common variant)
For each raw score s:
curved = sqrt(s / max) * max
This rescales scores by applying the square root to the normalized score, then multiplying back by max.
Example
Raw scores: 65, 72, 88, 91, 55.5, max = 100.
Compute for each:
- Normalize:
s / max— e.g. 65/100 = 0.65 - Square root:
sqrt(0.65)≈ 0.8062257748 - Multiply by max:
0.8062257748 * 100 = 80.62257748→ round as desired, e.g., 80.62
Let’s compute one carefully digit-by-digit for 65:
- 65 / 100 = 0.65
- sqrt(0.65) approximated: 0.8062257748...
- ×100 = 80.62257748 → 80.62 (rounded to 2 decimals)
Apply similarly:
- 72 → 72/100 = 0.72; sqrt ≈ 0.8485281374; ×100 = 84.85
- 88 → 0.88; sqrt ≈ 0.9380831519; ×100 = 93.81
- 91 → 0.91; sqrt ≈ 0.9539392014; ×100 = 95.39
- 55.5 → 0.555; sqrt ≈ 0.744...; ×100 ≈ 74.45
(Exact decimals will depend on the rounding precision you choose.)
Example Table:
| Student | Raw Score | Curved Score | Note |
|---|---|---|---|
| Alice | 65 | 80.6 | Boosted more |
| Bob | 72 | 85.2 | Boosted moderately |
| Carol | 88 | 93.6 | Slight boost |
| David | 91 | 95.3 | Slight boost |
| Eve | 55.5 | 74.0 | Boosted most |
Pros
- Benefits lower scores more than higher ones — helps weak students without excessively inflating top performers.
- Smooth, continuous transformation.
Cons
- Non-intuitive: harder to explain to students than an additive shift.
- Changes ranking only if rounding differences occur.
- Doesn’t target a specific mean or standard deviation.
Best Use: Use this curve a test calculator when you want to reduce failure rates while maintaining fairness for high performers.
4) Z-Score (Bell Curve / Standardization) — what it does and example
What it does
This method uses z-scores to adjust all scores so that the mean and standard deviation match your target. It is often called a grading on a bell curve calculator.
Formula
Let:
mean_raw= mean of raw scoresstd_raw= standard deviation of raw scores (population or sample — this tool uses population: divide variance by N)- For each raw score
s:z = (s - mean_raw) / std_rawcurved = targetMean + z * targetStdDev- Then cap:
curved = min(max, curved)and optionally floor at 0.
Carefully worked example
Raw scores: 65, 72, 88, 91, 55.5. We'll compute mean and std (population standard deviation) step by step.
- Sum: 65 + 72 + 88 + 91 + 55.5 =
- 65 + 72 = 137
- 137 + 88 = 225
- 225 + 91 = 316
- 316 + 55.5 = 371.5
- Mean = sum / N = 371.5 / 5 =
- 371.5 ÷ 5 = 74.3
- Compute variance:
- (65 − 74.3) = −9.3 → squared = 86.49
- (72 − 74.3) = −2.3 → squared = 5.29
- (88 − 74.3) = 13.7 → squared = 187.69
- (91 − 74.3) = 16.7 → squared = 278.89
- (55.5 − 74.3) = −18.8 → squared = 353.44
- 86.49 + 5.29 = 91.78
- 91.78 + 187.69 = 279.47
- 279.47 + 278.89 = 558.36
- 558.36 + 353.44 = 911.8
- Std Dev = sqrt(182.36) ≈ 13.500...
- We'll compute: sqrt(182.36) ≈ 13.504 (rounded to three decimals)
- Now choose a target mean and std dev, e.g.
targetMean = 75,targetStdDev = 10. - Compute z and mapped curved for one score, say
88:- z = (88 − 74.3) / 13.504 ≈ 13.7 / 13.504 ≈ 1.014
- curved = 75 + 1.014 × 10 ≈ 75 + 10.14 = 85.14
Repeat for each score:
- 65: z = (65 − 74.3)/13.504 = −9.3/13.504 ≈ −0.688; curved ≈ 75 + (−0.688×10) ≈ 75 − 6.88 = 68.12
- 72: z ≈ −2.3/13.504 ≈ −0.170; curved ≈ 75 − 1.70 = 73.30
- 88: as above ≈ 85.14
- 91: z ≈ 16.7/13.504 ≈ 1.237; curved ≈ 75 + 12.37 = 87.37
- 55.5: z ≈ −18.8/13.504 ≈ −1.392; curved ≈ 75 − 13.92 = 61.08
(Your calculator or the tool will get the precise decimals and will usually round to the number of decimals you select.)
Example Table (Target Mean = 75, Target Std Dev = 10):
| Student | Raw Score | Curved Score | Note |
|---|---|---|---|
| Alice | 65 | 66.8 | Slightly below mean |
| Bob | 72 | 73.4 | Near mean |
| Carol | 88 | 86.0 | Above mean |
| David | 91 | 89.2 | Well above mean |
| Eve | 55.5 | 56.5 | Far below mean |
Pros
- Targets a desired mean and spread — useful for shaping the overall distribution to policy or expectation.
- Keeps relative performance consistent through z-scores (students with same z remain same percentile).
- Powerful when you want to moderate extremes and standardize cohorts.
Cons
- More complex to explain — students may not intuitively understand z-scores.
- If raw standard deviation is extremely small (everyone got nearly identical scores), you cannot divide by zero; the tool will refuse and require a different method.
- Can compress or expand differences in ways instructors may not want if targetStdDev is very different from raw std.
Best Use: Standardize scores across different classes or semesters.
How To Use Curve Grade Calculator — step-by-step
- Paste raw scores (comma, space, or newline separated). Non-numeric entries are ignored.
- Set the Max Possible Score (e.g., 100).
- Choose Rounding Decimals for display (0–6).
- Select a method and fill method-specific parameters:
- Additive Points: enter points to add.
- Z-Score: enter
target meanandtarget std dev.
- Click Calculate & Curve — view results, statistics, and per-student notes (e.g., “Capped at max”).
- Save settings (optional): saved to Firestore if configured, otherwise to localStorage.
- Download CSV if you need a spreadsheet.
Conclusion
A Curve Grade Calculator helps educators adjust scores fairly while being transparent about methods. Each method serves a different purpose:
| Method | Best for |
|---|---|
| Target Max | Boosting the top student to maximum |
| Additive Points | Evenly increasing scores across the board |
| Square-Root | Rewarding students with lower scores |
| Z-Score | Normalizing scores to a target mean and distribution |
By using these curves, instructors can ensure grades are fair, balanced, and reflective of student effort.